
Business problem
Weekly reporting depended on manual Excel work.
New Media Group runs multiple content brands in Hong Kong. Its platform team had to consolidate data from more than 12 analytics tools for over 50 staff, then manually aggregate it in Excel each week.
Editors depended on that team for performance data. Reports arrived late, the numbers were difficult to interpret, and some editors had to ask their supervisors to see their own results. Senior editors also needed to set goals, review the team and find topics for new content.
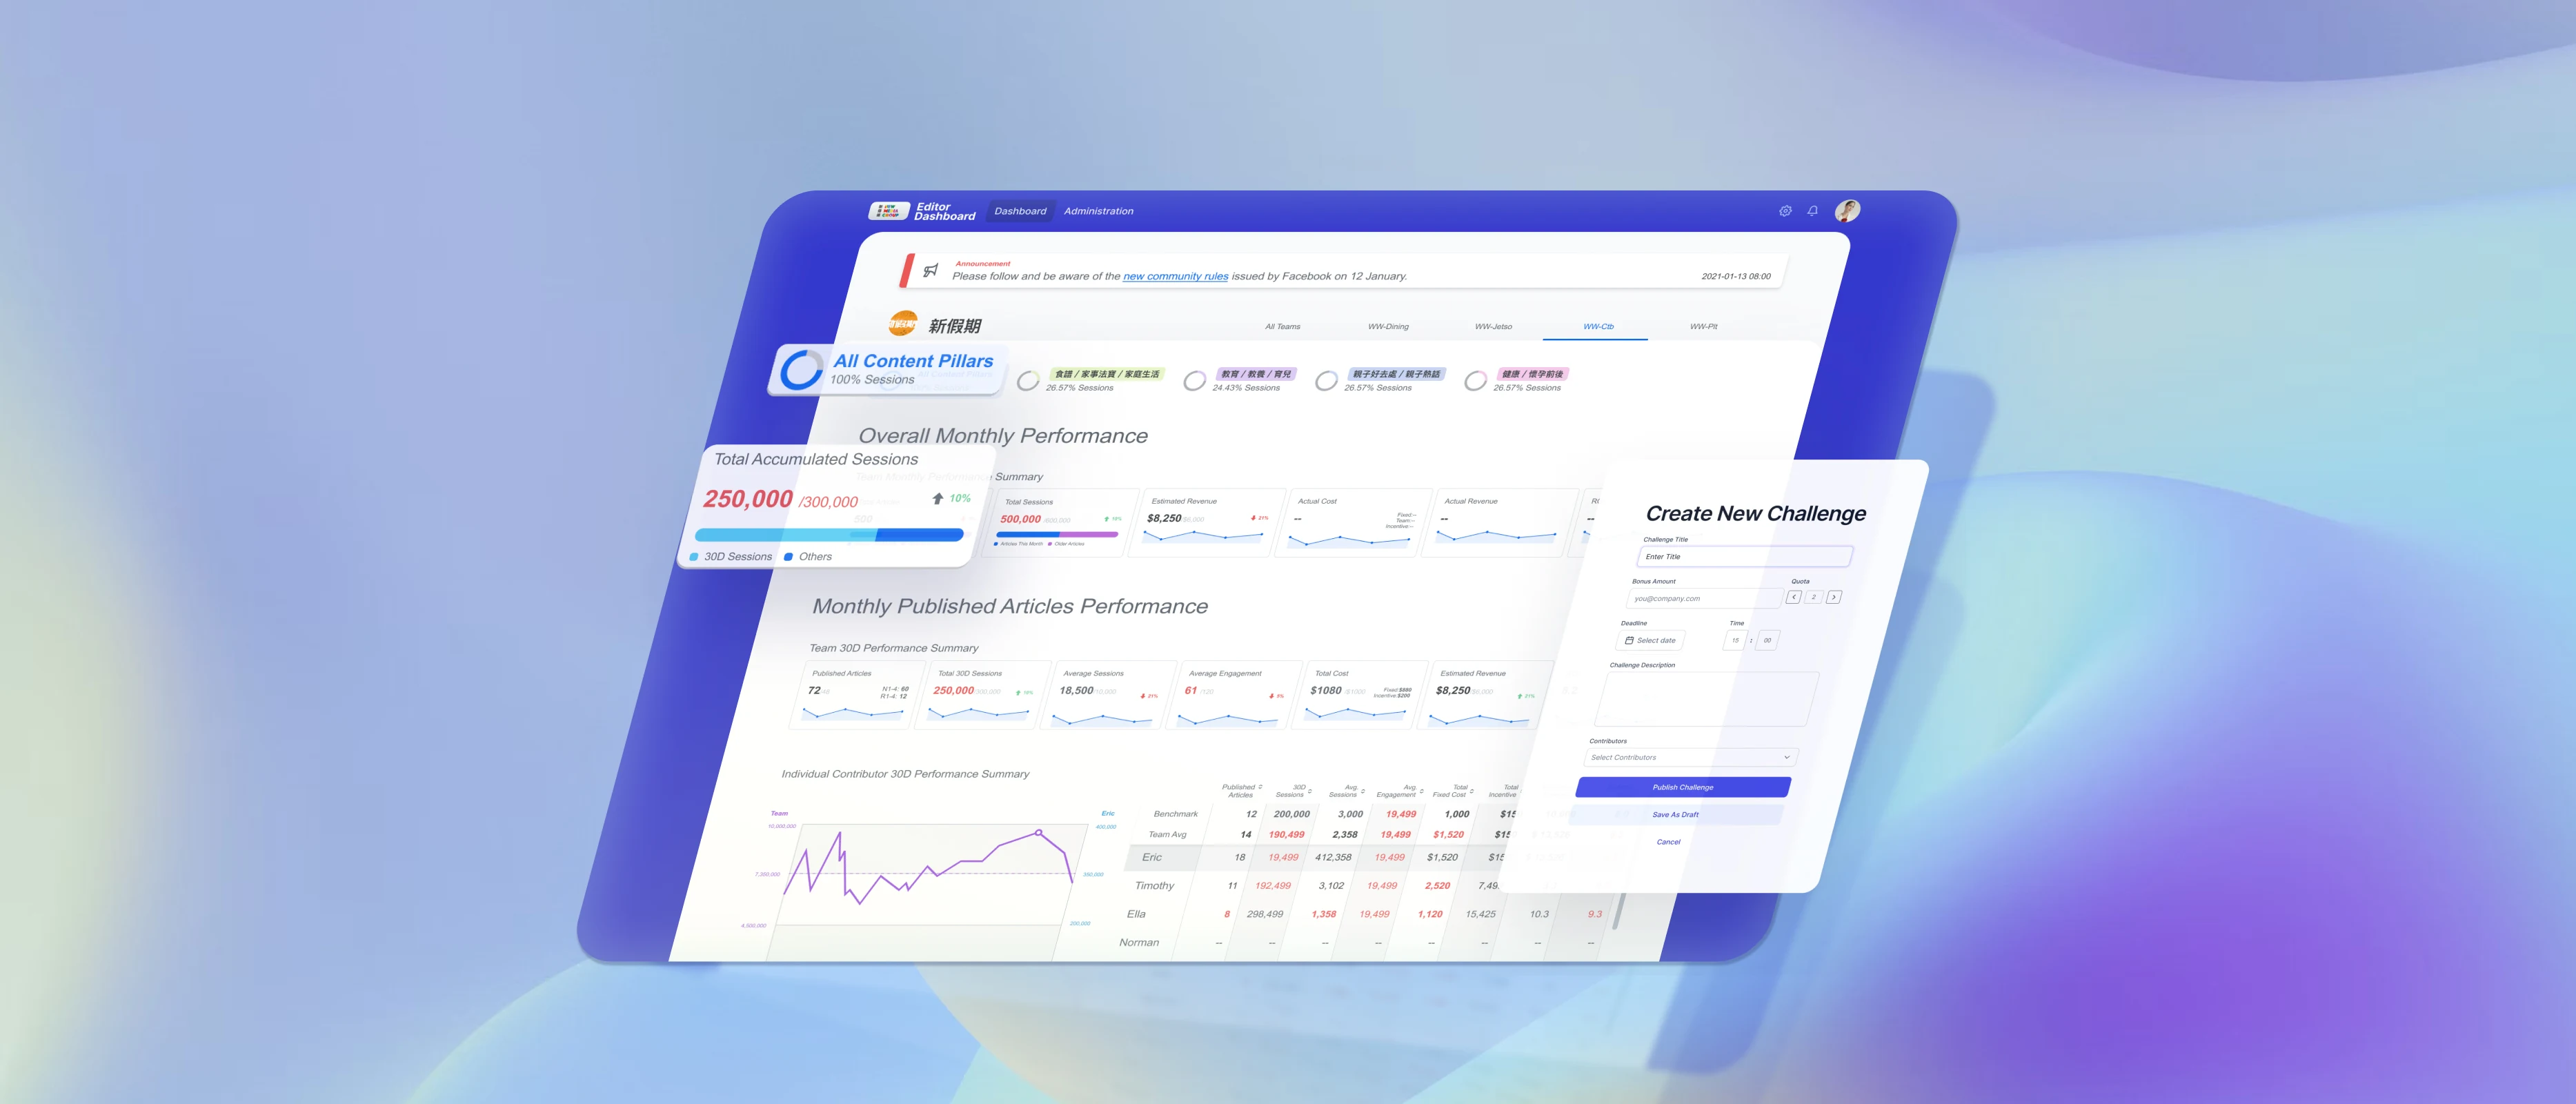
I was asked to design a shared web platform for content and staff performance. It needed to support these different roles within a scope the team could build for the first release.
Research & direction
Three roles needed different views.
I conducted seven online interviews with stakeholders and users, including editors, senior editors and the platform team. The recurring problems were fragmented sources, delayed access and limited visibility into performance.
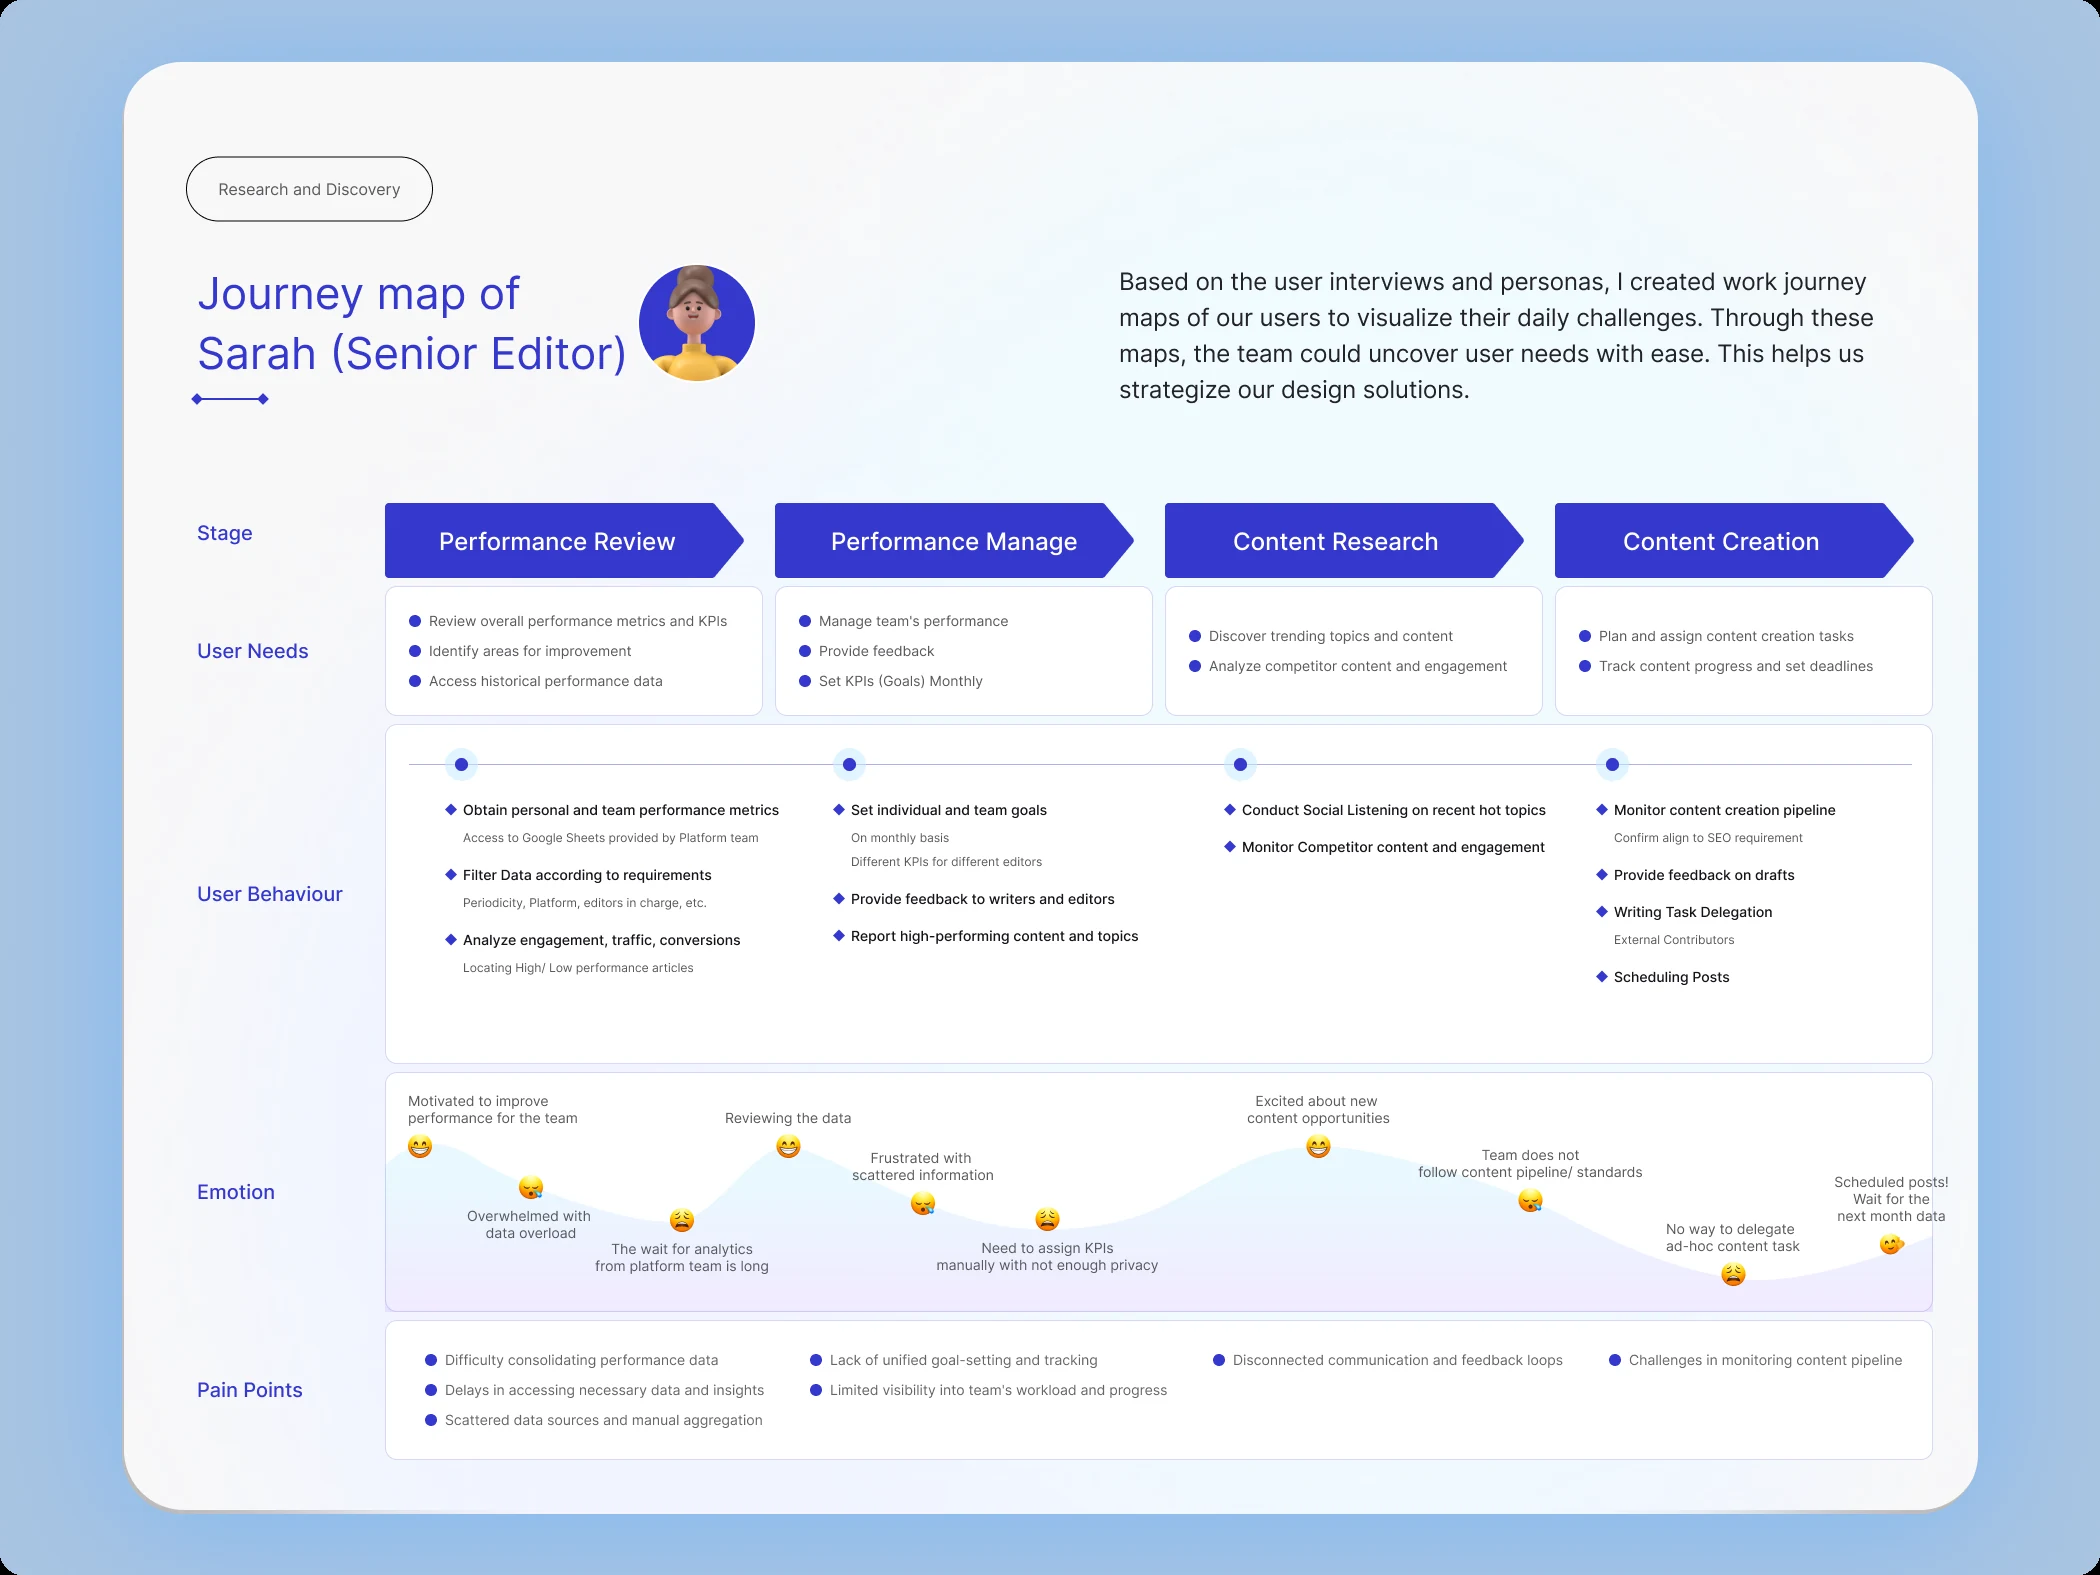
I created personas and journey maps to connect those findings to daily work. The senior-editor journey ran from reviewing performance and setting monthly goals to researching topics and assigning content. Waiting for data and manually tracking goals interrupted that work.
The platform team needed to compare business units. Senior editors needed to track team goals and compare results, while individual editors needed access to their own performance. I used these needs to define the views for each role.
Design decisions
Put performance in context.
Move the KPI tracker into the main view.
I used mid-fidelity designs with example data to review the layout with users and stakeholders. The first version gave substantial space to social listening, while staff performance sat lower in the page.
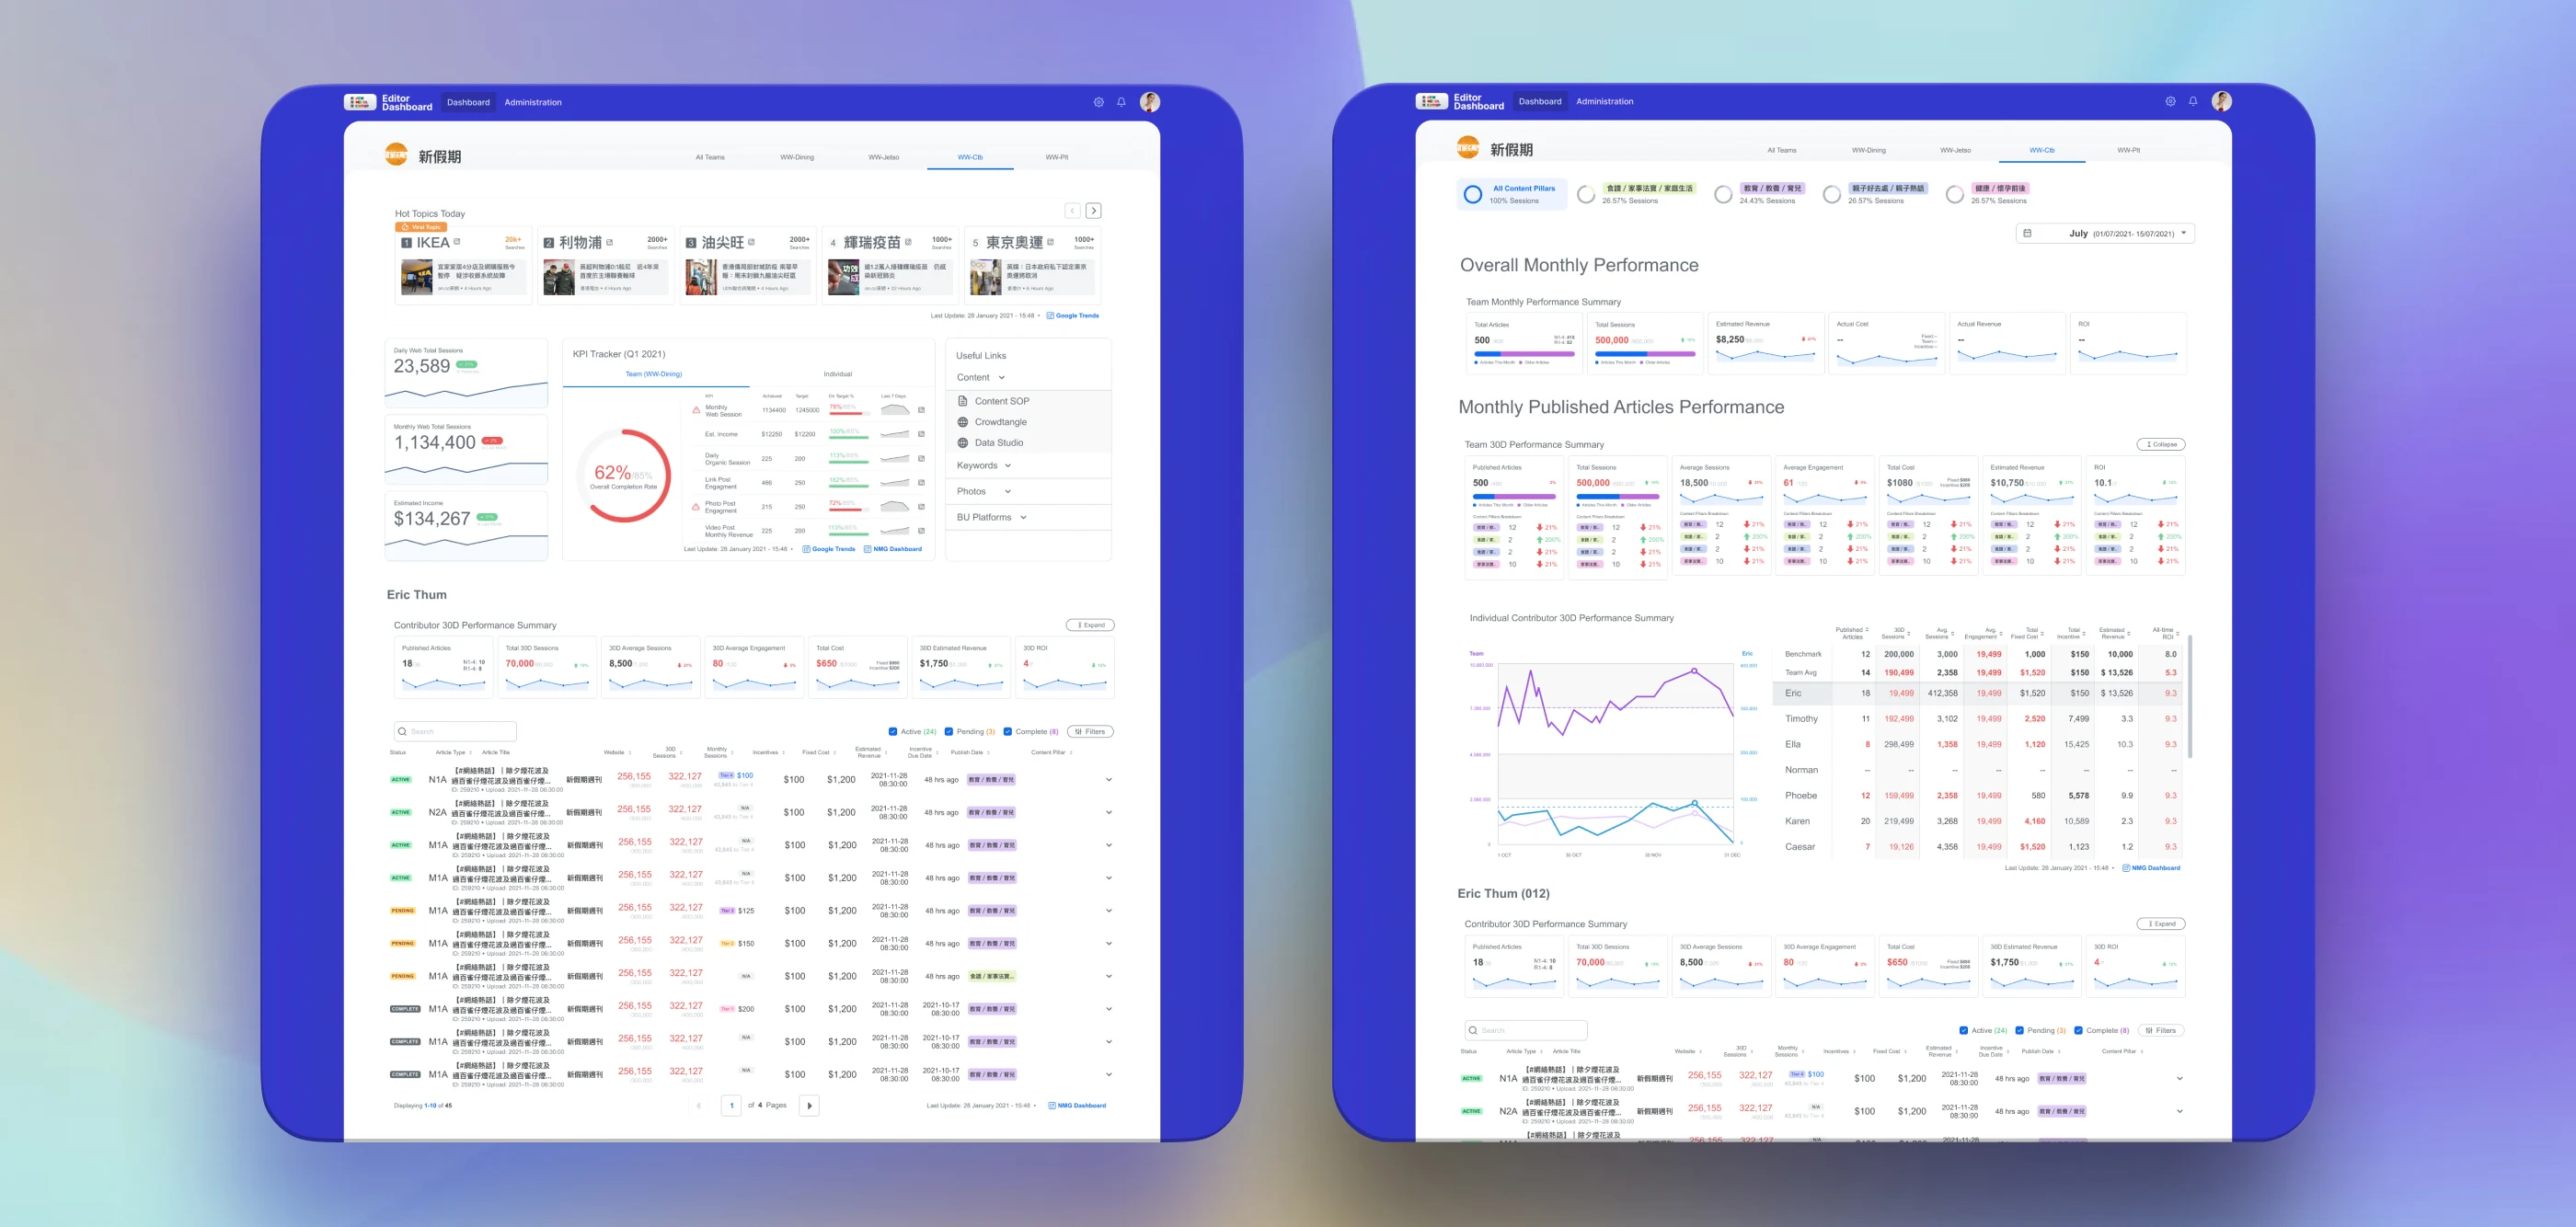
I moved the KPI tracker into a prominent panel and added an article-metrics summary. In later iterations, I grouped article performance by content pillar and refined the comparison tables. I wanted users to see overall performance first, then inspect contributors and individual articles.
Show each role the comparison they need.
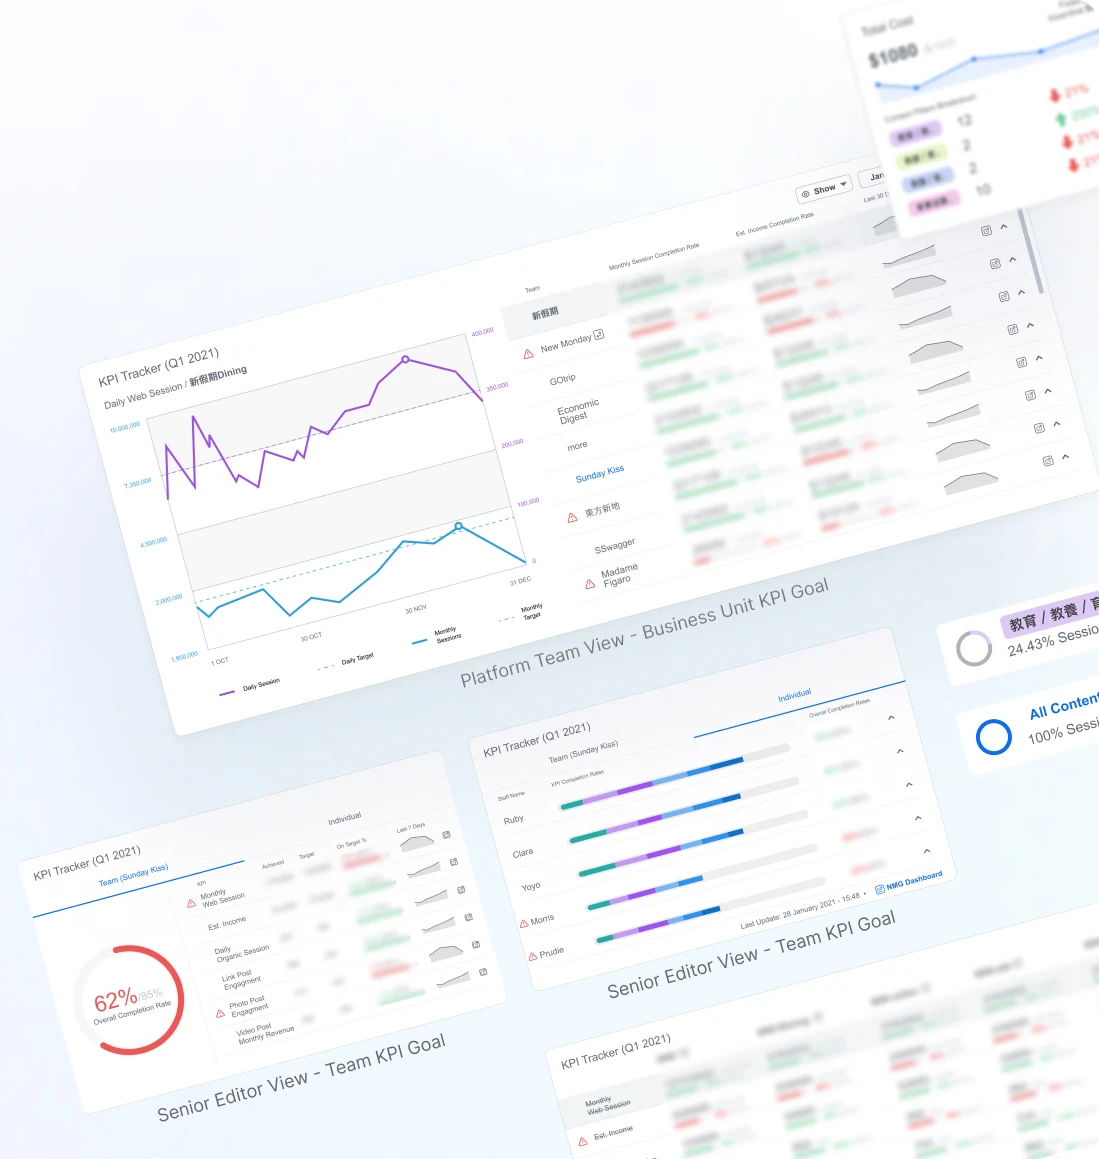
I worked with the team to identify the metrics that mattered for each user group. The platform-team view compares performance across business units. The senior-editor view combines team targets with individual progress, while contributor summaries connect staff performance to their published articles.
I paired charts showing trends and progress with tables of exact values. Users could scan the summary and check the numbers during a performance review.
Scope & collaboration
Scope the first release with developers.
I facilitated a four-person scoping workshop with stakeholder and development representatives. We ranked features by urgency and importance to define the MVP.
Resource constraints led us to reduce the social-listening integration. We kept a smaller Hot Topics section for content ideas and gave more space to performance tracking. Quick Links provided access to frequently used tools and sources.
I also presented two visual directions. Users chose the brighter theme because they said it helped them identify the dashboard among the many browser tabs used in their daily work.
Outcome & reflection
Less time spent assembling the data.
Project reporting one quarter after implementation recorded 50% less time spent consolidating and analysing data, 25% higher content output and a 21% increase in individual and team goal attainment. These are reported project results; the measurement method was not documented.
After the MVP was implemented, users said it was easier to get the data they needed. Mapping editorial routines helped me explain priorities through the tasks people were trying to complete. Discussing those priorities with developers helped us decide what to build.
I would follow up by observing a performance-review session and timing how long it takes to answer common questions. I would also check which questions editors can answer themselves and where they still need the platform team.