
Business problem
Client reports took days to prepare.
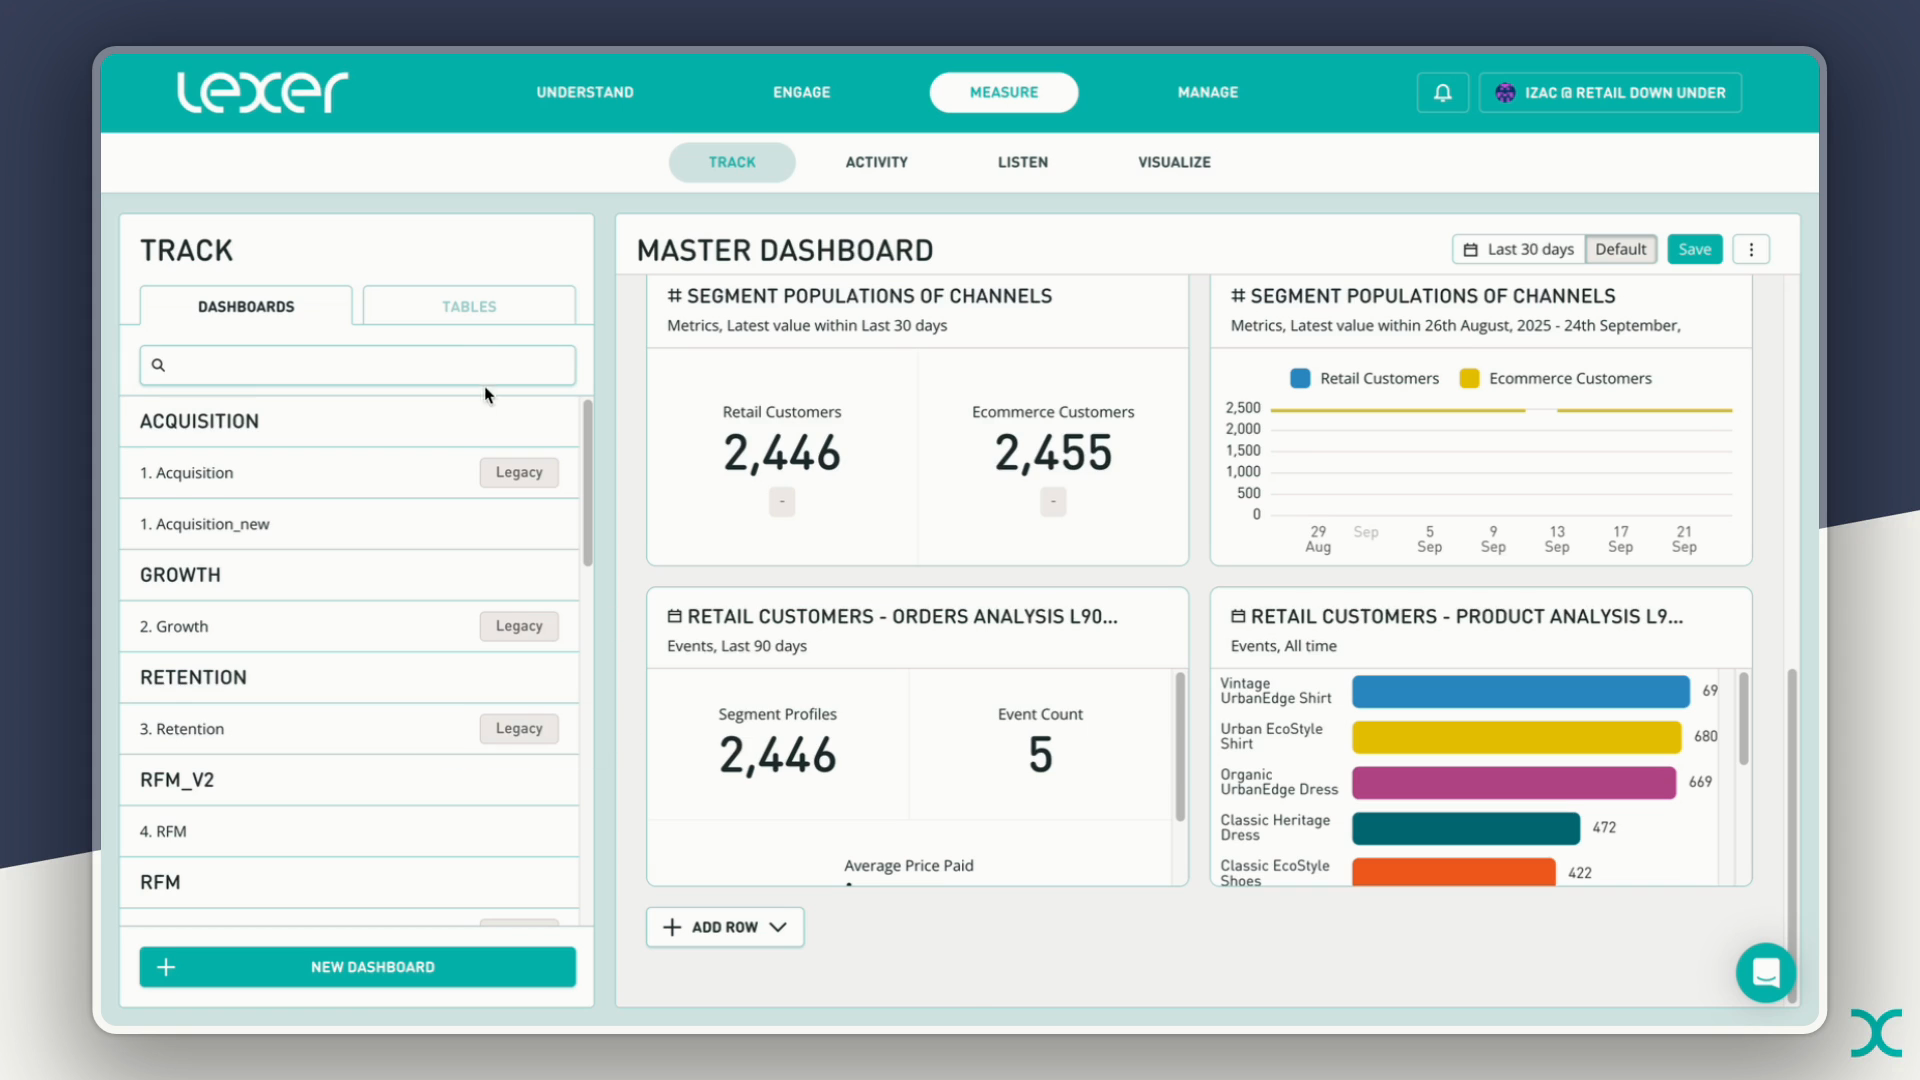
Lexer unifies customer, product and marketing data for retail and hospitality brands. Dashboards were its customer-success team’s way to show clients the value of that data, but preparing a report took around three days.
Clients relied on consultants to assemble reports, and consultants copied results into slides or Power BI when the dashboard was too hard to read. Reporting effort grew with each account.
I needed to make reports quicker to build, easier to read and shareable, while working within a legacy component library and limited engineering capacity. The release also had to support a transition from more than 200 existing dashboards.
Evidence & direction
Designing around consultants’ reporting work.
I reviewed usage across seven client hubs, watched session replays of three consultants and interviewed four customer-success consultants who built reports for clients. This gave me a view of the reporting workflow through its internal users.
The hubs contained 203 dashboards with an average of 21 cards, and viewing dashboards dominated Track usage. Reports needed to be readable as a whole. In the replays, consultants repeatedly searched for and added metrics to construct cards, which led me to prioritise reusing existing tables and simplifying new-card creation.
All four consultants raised data presentation, adding metrics, tables in dashboards and export. Screenshots, slides and external tools were recurring workarounds. Templates, AI analysis and bulk-add each came up once. I used those findings to focus the first release on assembling and sharing readable reports.
Design decisions
A reusable reporting canvas.
Reuse existing tables.
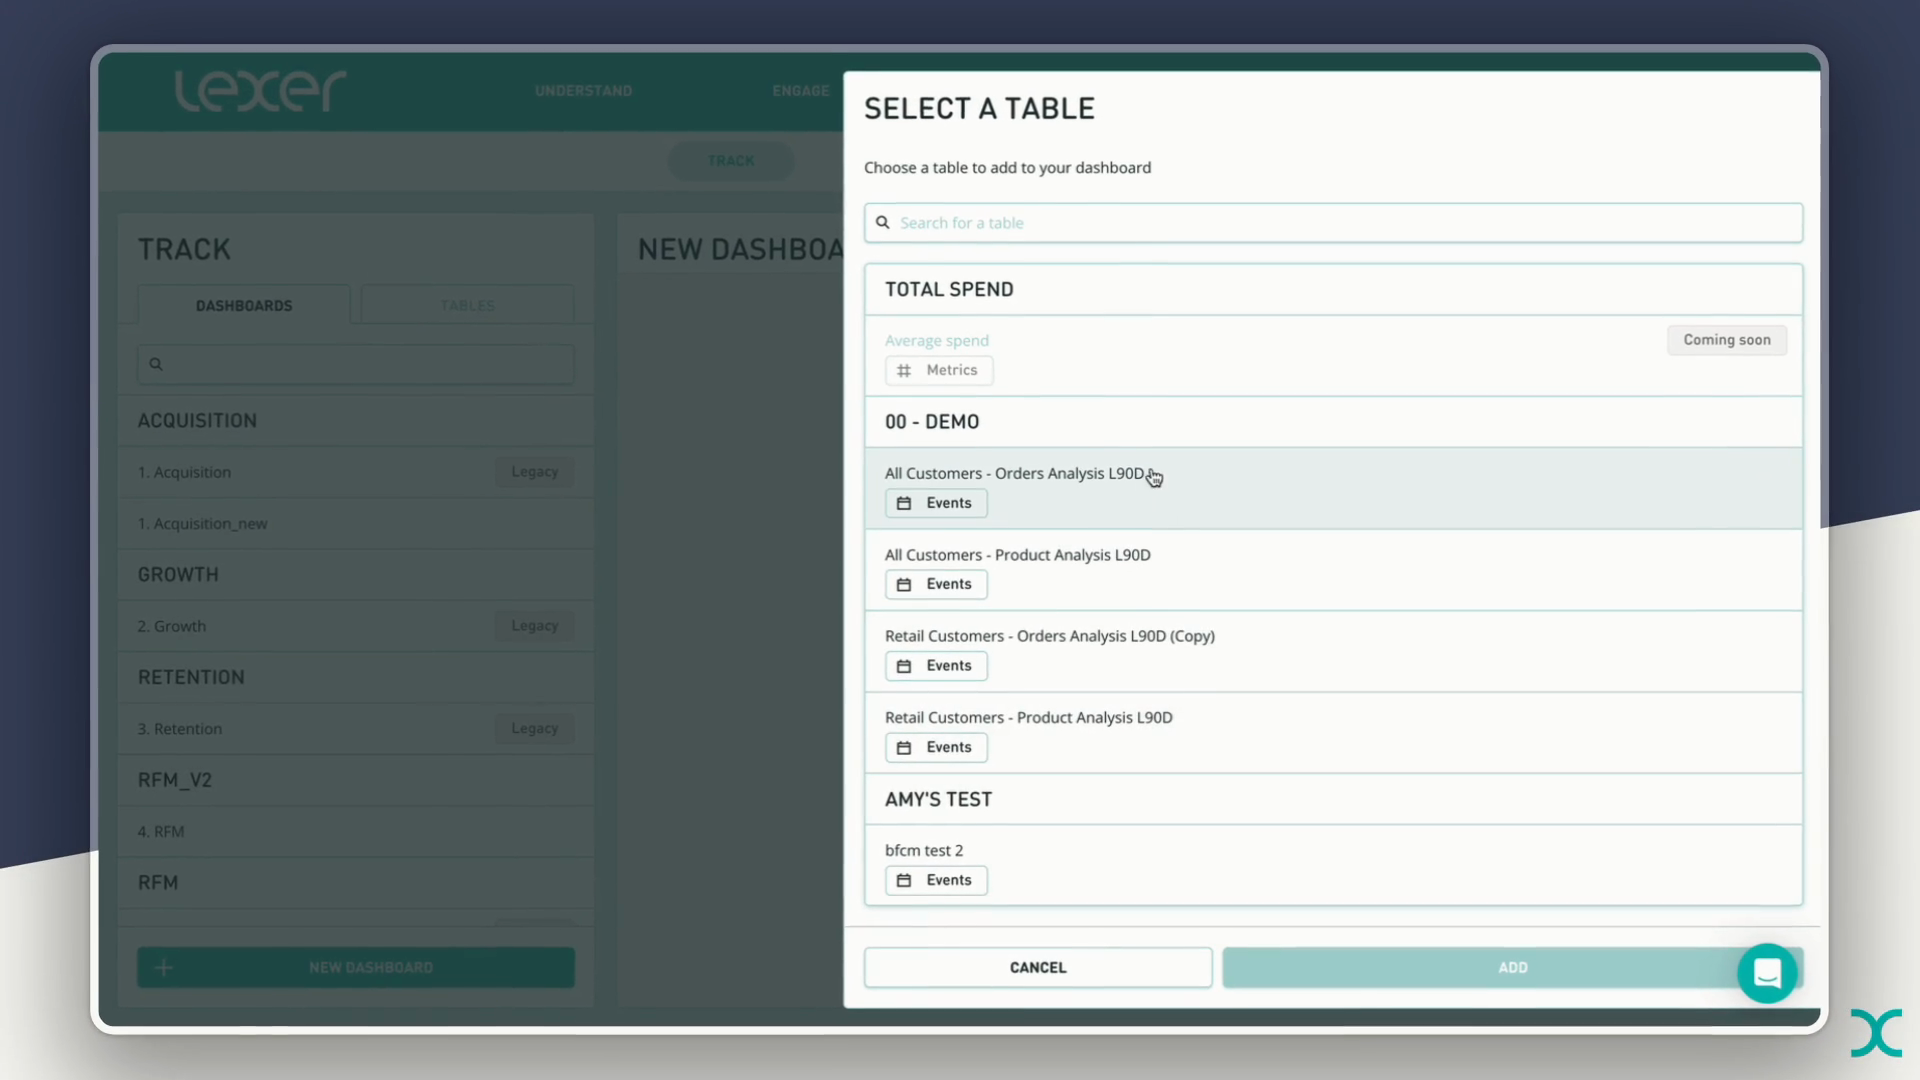
Consultants preferred working in tables because they were faster to set up and export. I designed a way to bring an existing Track table or Event Explorer view into a dashboard in two clicks, with Edit in table returning to the source.
For new metrics, a guided builder lets users choose, name and preview a card before placing it. The flow replaces the repeated drag-and-drop setup.
A flexible layout for each report.
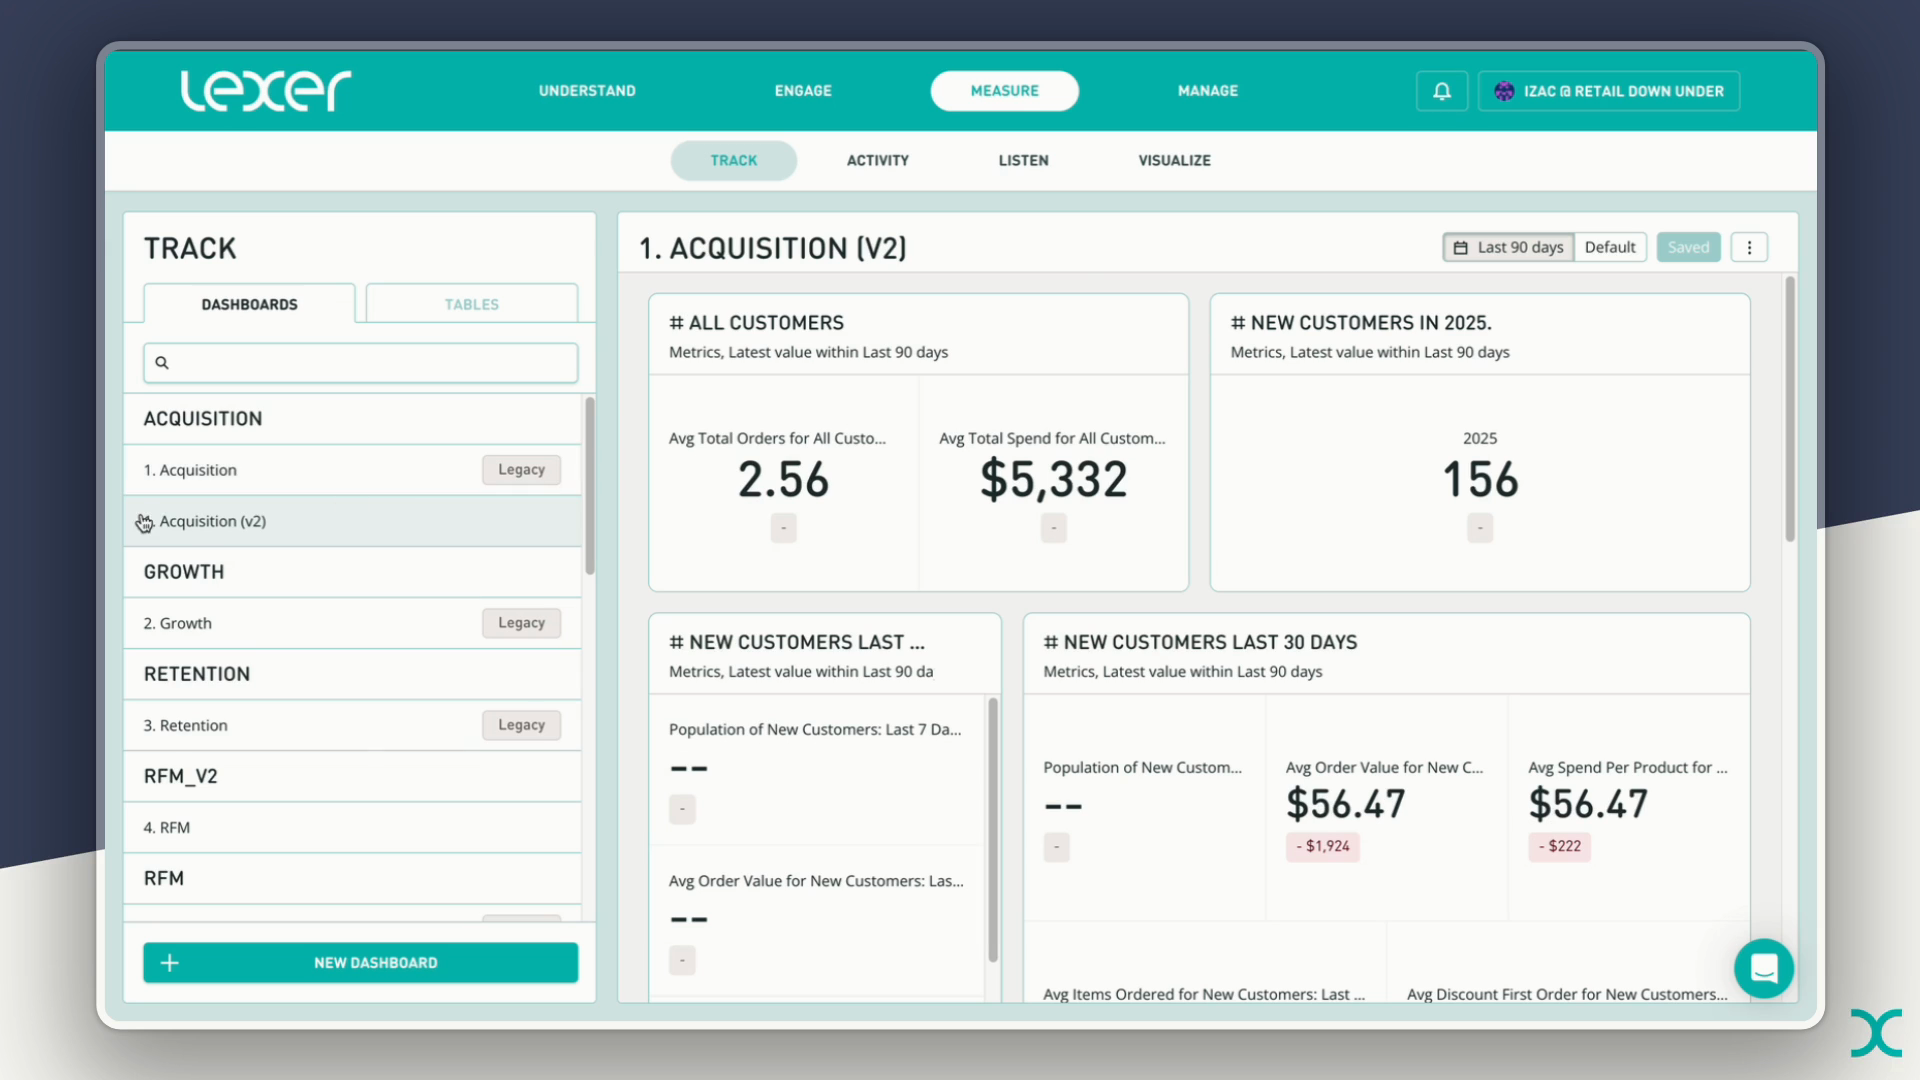
I replaced the rigid two-column layout with a 12-column, row-and-block canvas. Tables, metric cards and text become the building blocks: a summary can stay compact, a chart can span a row, and text can introduce a new section.
Fixed columns
Repeated initial/current/delta values
One long, dense page
Resizable, reorderable blocks
Metric values with delta chips
Text and sections for context
Users can change the chart type within a card without rebuilding it. Dashboard defaults apply report-wide changes, while card locks preserve fixed campaign dates.
Scope & trade-offs
Choosing what to ship for sharing and export.
I worked with the team to focus the first release on sharing within Lexer and exporting individual results. Product leadership approved the scope, and I made the design trade-offs within it.
- Internal dashboard links and chart/table CSV export
- Whole-report export, public sharing and scheduled delivery
- AI analysis
Whole-report PDF was a recurring request, but we deferred it because of the engineering capacity needed. The new layout improved readability; portable reports remained an unmet need. I documented the deferred requests for later releases.
Shipping the change
An upgrade consultants could make at their own pace.
I worked with engineering through the build. Existing dashboards stayed viewable and were marked Legacy. Upgrading created a v2 copy alongside the original, so consultants could rebuild at their own pace.
Keeping both versions meant temporary duplication in the sidebar and some manual rebuilding. Existing client reports stayed unchanged during the transition.
Outcomes & limits
Reported time savings and adoption.
The customer-success team estimated that planning and building a dashboard fell from around three days to four hours. Mixpanel recorded 81.6% weekly retention for v2 and 68% for legacy dashboards across different periods and cohorts, alongside 577 save events from early rollout to mid-January 2026.
What I would test next
I would measure report preparation time and test whether first-time users understand how dashboard defaults and card locks work together. I’d also investigate how much reporting consultants still do in other tools while whole-report export remains unavailable.