
Problem & challenges
The display grew from 8 to 30 metres.
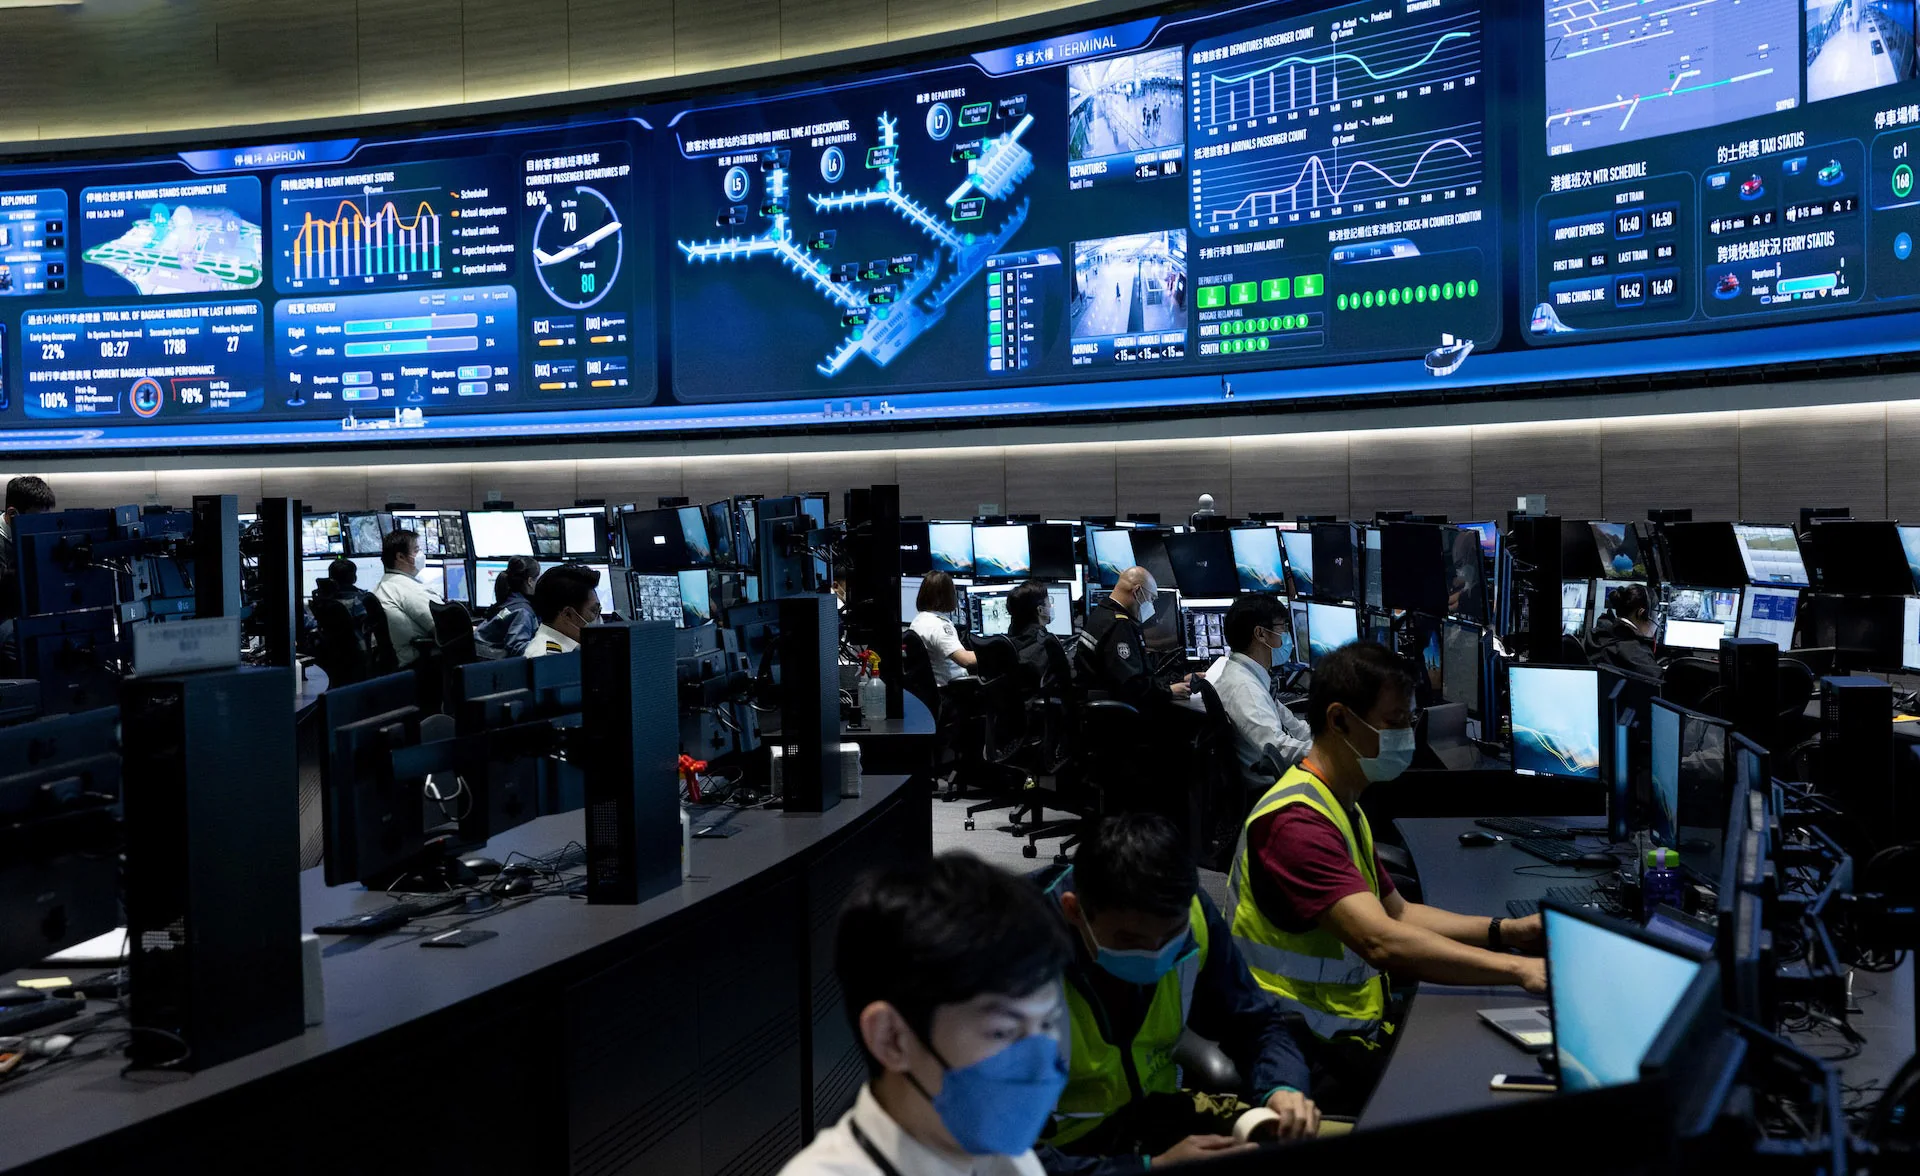
HKIA was introducing Digital Twin and IoT data into its operations centre. The Digital Apron would give staff a shared view of activity across the airfield, terminal and transport network.
As the display grew from 8 to 30 metres, the brief expanded to include more information. The early design required manual page changes, but staff needed to monitor the feeds together.
The airport also had a growing collection of data assets. We needed the people managing operations to help decide which feeds belonged on the wall.
Research & direction
Operators helped decide what belonged on the wall.
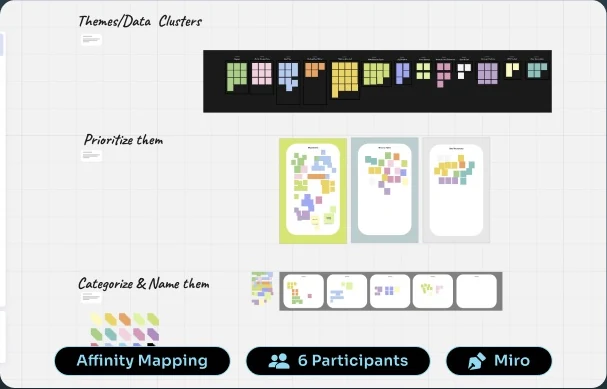
I prepared around 50 data items across 13 themes and ran an open-ended affinity-mapping workshop in Miro. Two project executives and four operators, including airline staff, took part.
Participants ranked each item as must-have, nice-to-have or unnecessary, then grouped and named the must-haves. We used their priorities to choose the data for the display.
I compiled the workshop output into a data factsheet. The 39 prioritised items formed four main sections: ground-air, apron, terminal and transportation. Within those sections, I grouped the data into eight themes and proposed charts and imagery in a mid-fidelity wireframe for stakeholders to review.
Design decisions
Design for monitoring across a room.
Keep the operational picture visible.
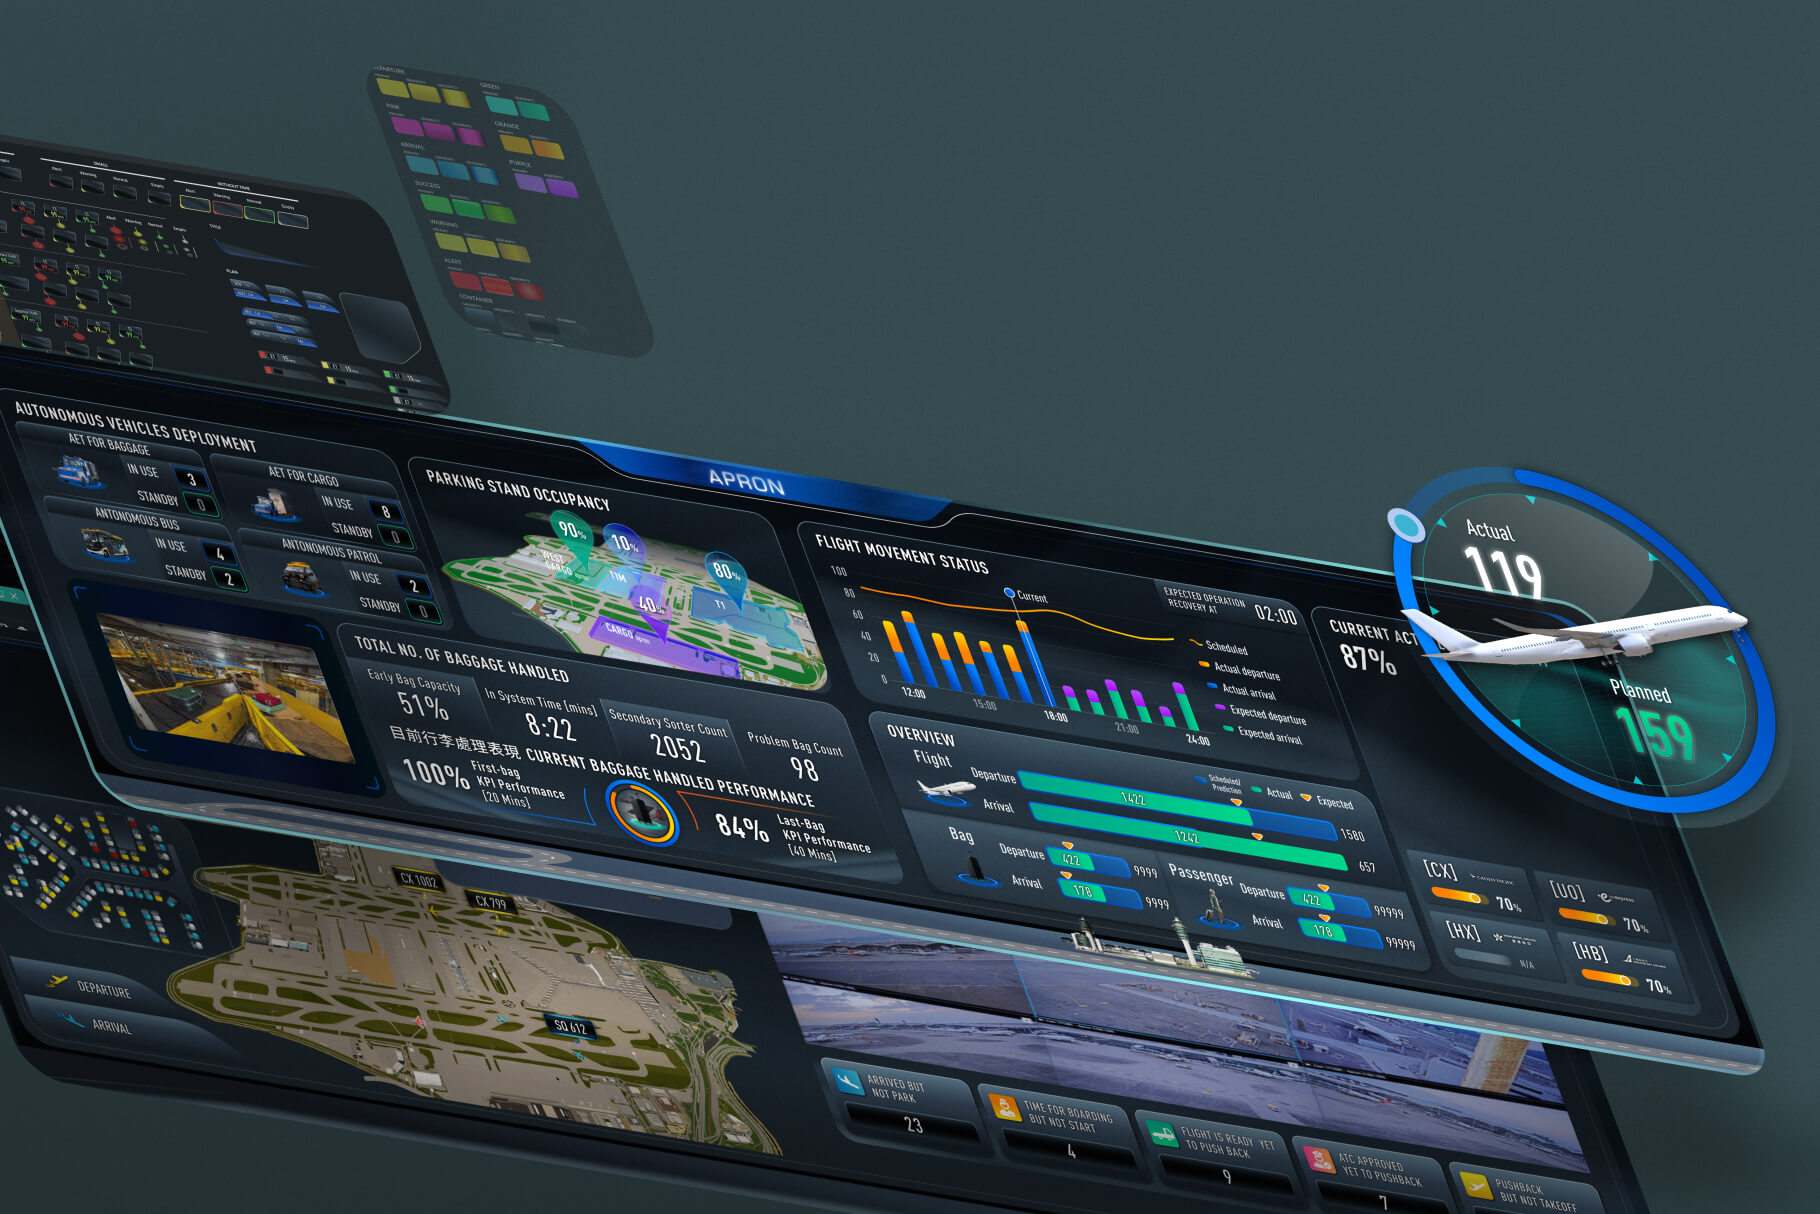
I grouped related feeds within the four main sections so staff could find ground-air, apron, terminal and transportation information without changing pages.
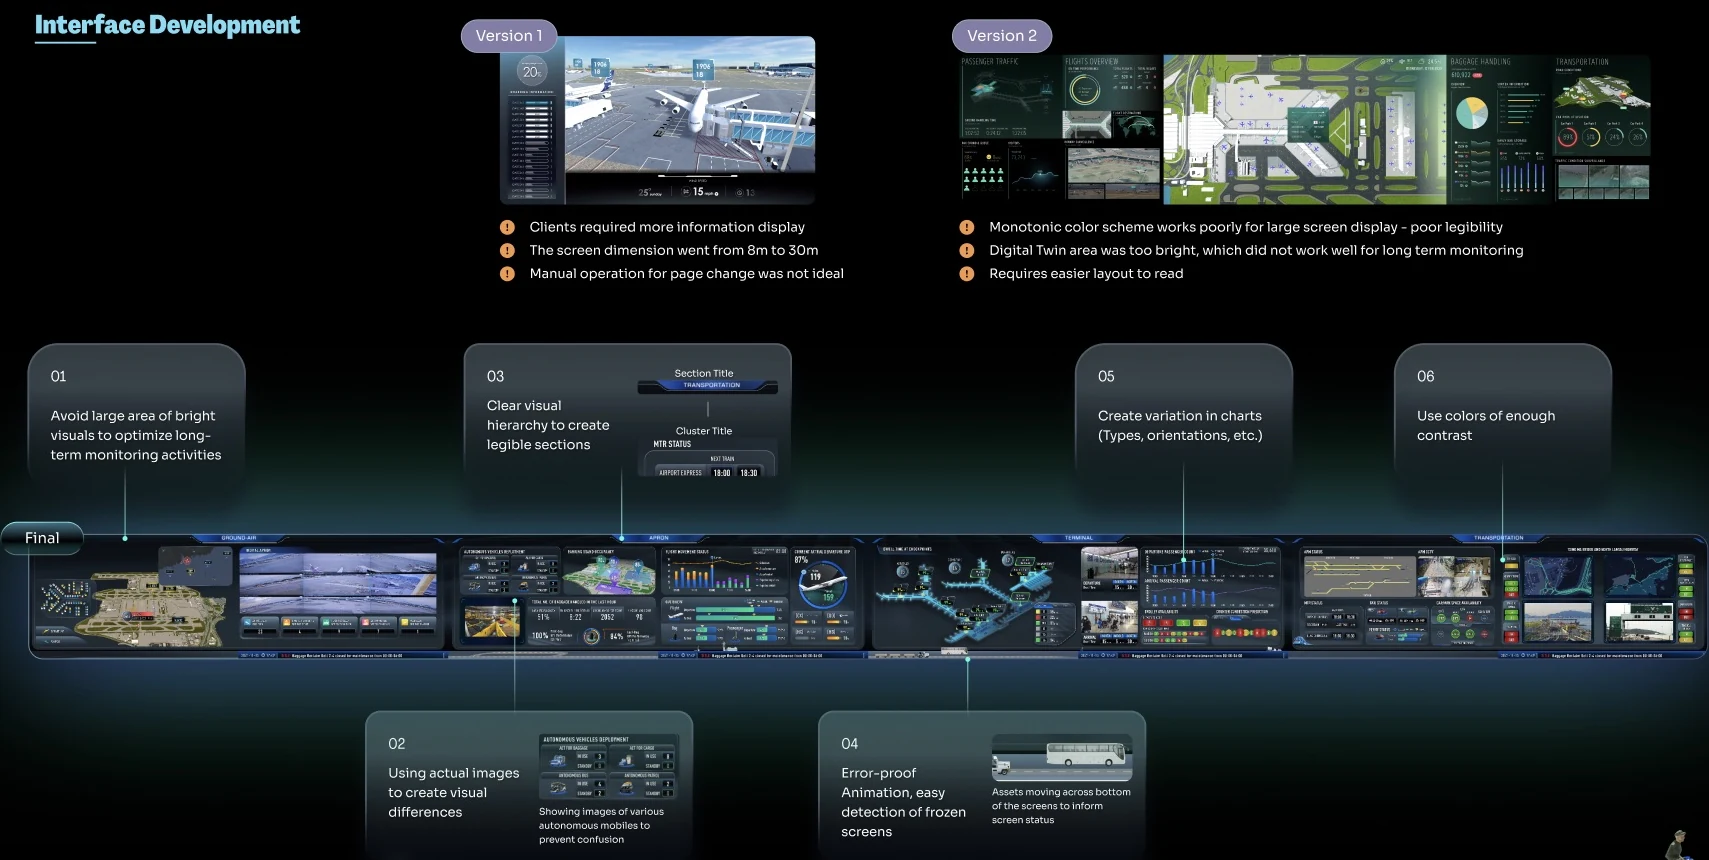
With more information visible at once, I used section and cluster titles to make the groups easier to scan. I varied chart types and orientations, and used actual vehicle imagery to distinguish similar assets.
Make dense data readable during long shifts.
In the second interface version, the monochrome palette made the large display hard to read, while the bright Digital Twin area was unsuitable for prolonged monitoring. The layout also needed clearer separation between information groups.
The final direction reduced large bright areas and used stronger colour contrast, clearer titles and more varied charts. We also included moving assets along the bottom of the display as a visible cue that could help staff notice a frozen screen.
Collaboration & delivery
A shared UI kit for the build.
The other designer and I worked together from the pitch through installation. I planned and coordinated the data workshop, designed the screens and prepared the UI kit for developers.
The factsheet recorded the agreed data groups, and the wireframes showed their arrangement on the screen. The UI kit gave developers a consistent set of visual assets.
Outcome & reflection
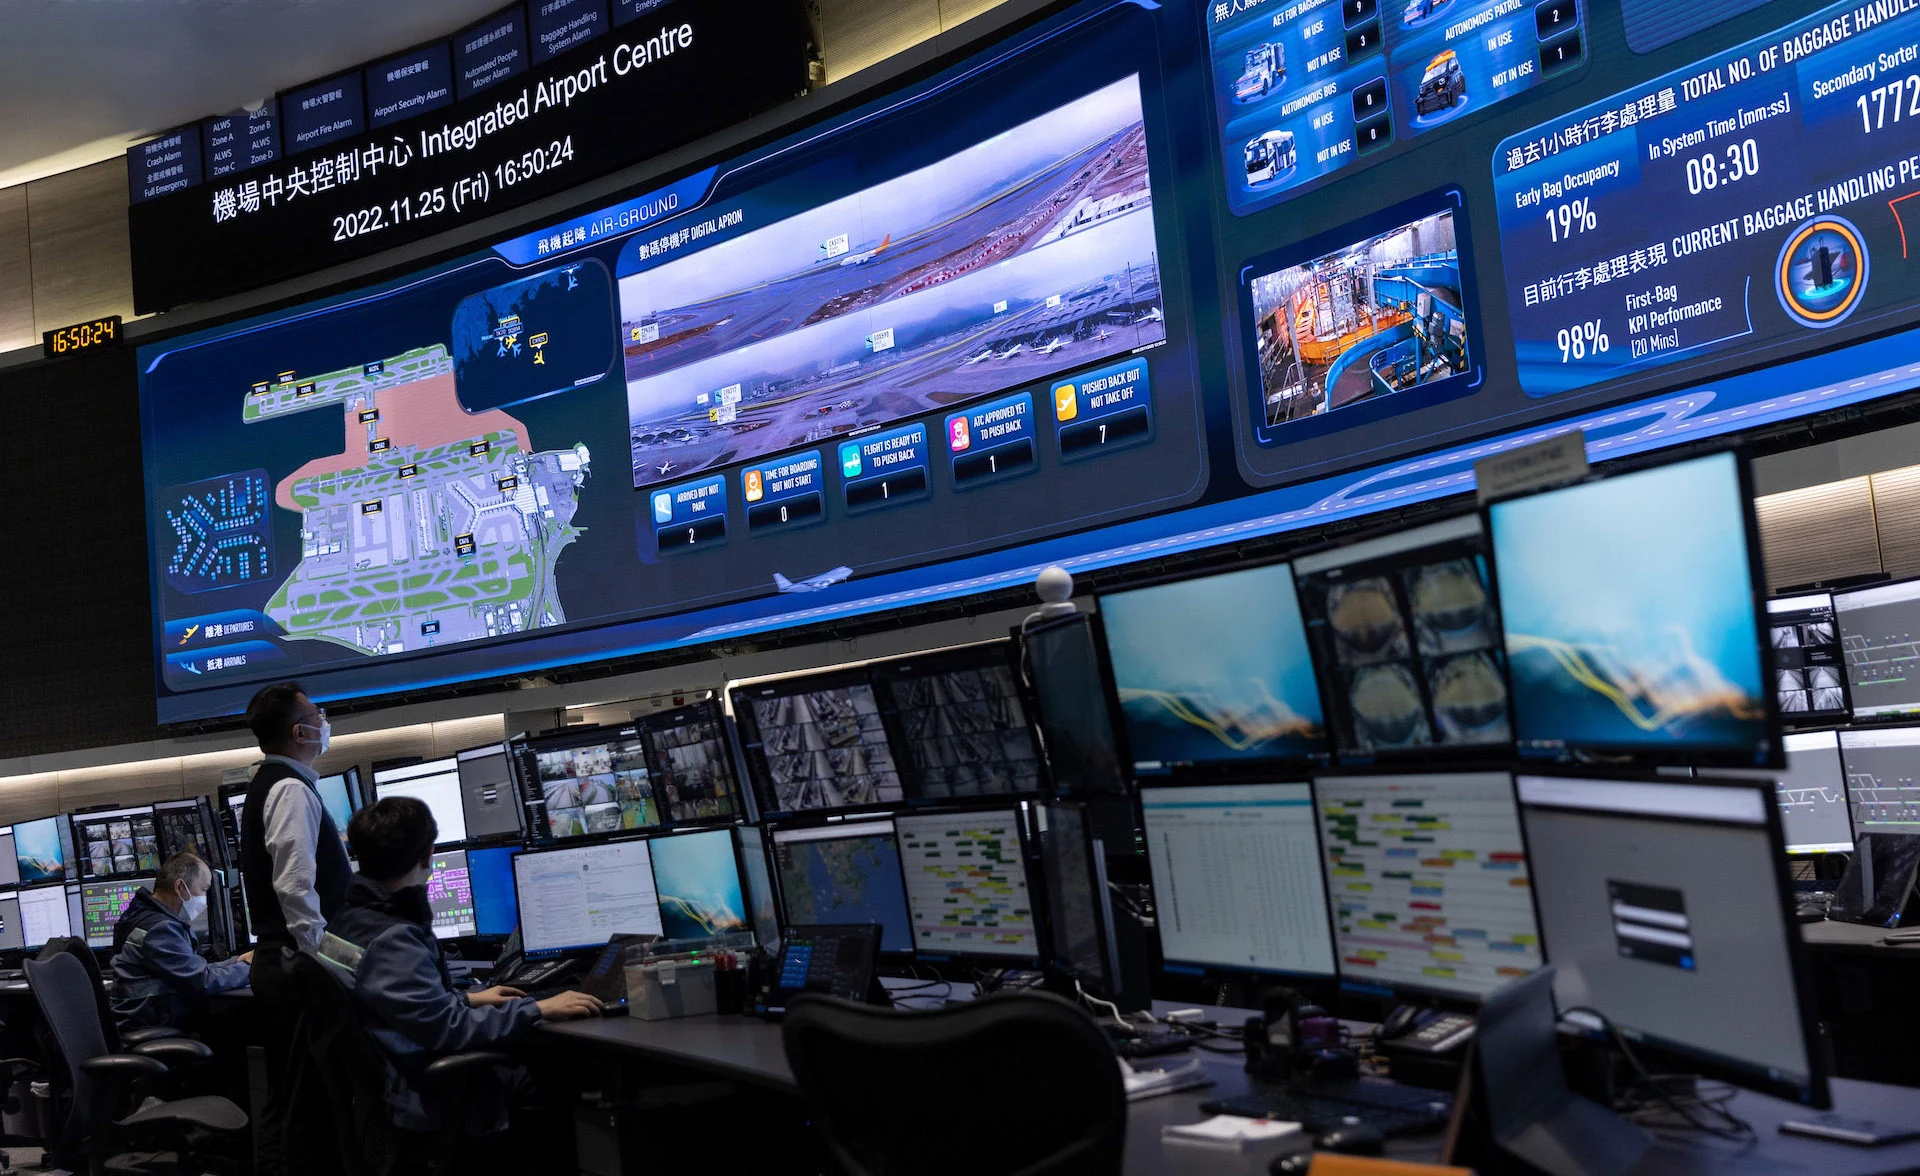
Installed in the Integrated Airport Centre.
The Digital Apron launched in 2022, displaying real-time data from more than 30 integrated systems for over 150 airport personnel. We delivered the installed display; I do not have measurements of changes in response time or operational efficiency.
Agreeing on the purpose and priority of the data gave us a basis for choosing the charts. The display’s physical scale also exposed readability problems that were easy to miss on a desktop.
On a similar project, I would test early mock-ups on the actual display with operators. I would check what they can read from their working positions and how quickly they can spot an abnormal status.